Current Assignment(s)
Due: Recommended by Monday, 5.21
Snooping on Others
![]()
One invaluable resource for web developers is the ability to look at the code for websites you visit. Browsers get code from servers, which means you can look at this code to try and inspect how someone else might have solved a problem.
During Workshops, you are expected to look at each other’s codes as Peer Reviewers, looking for errors and code choices.
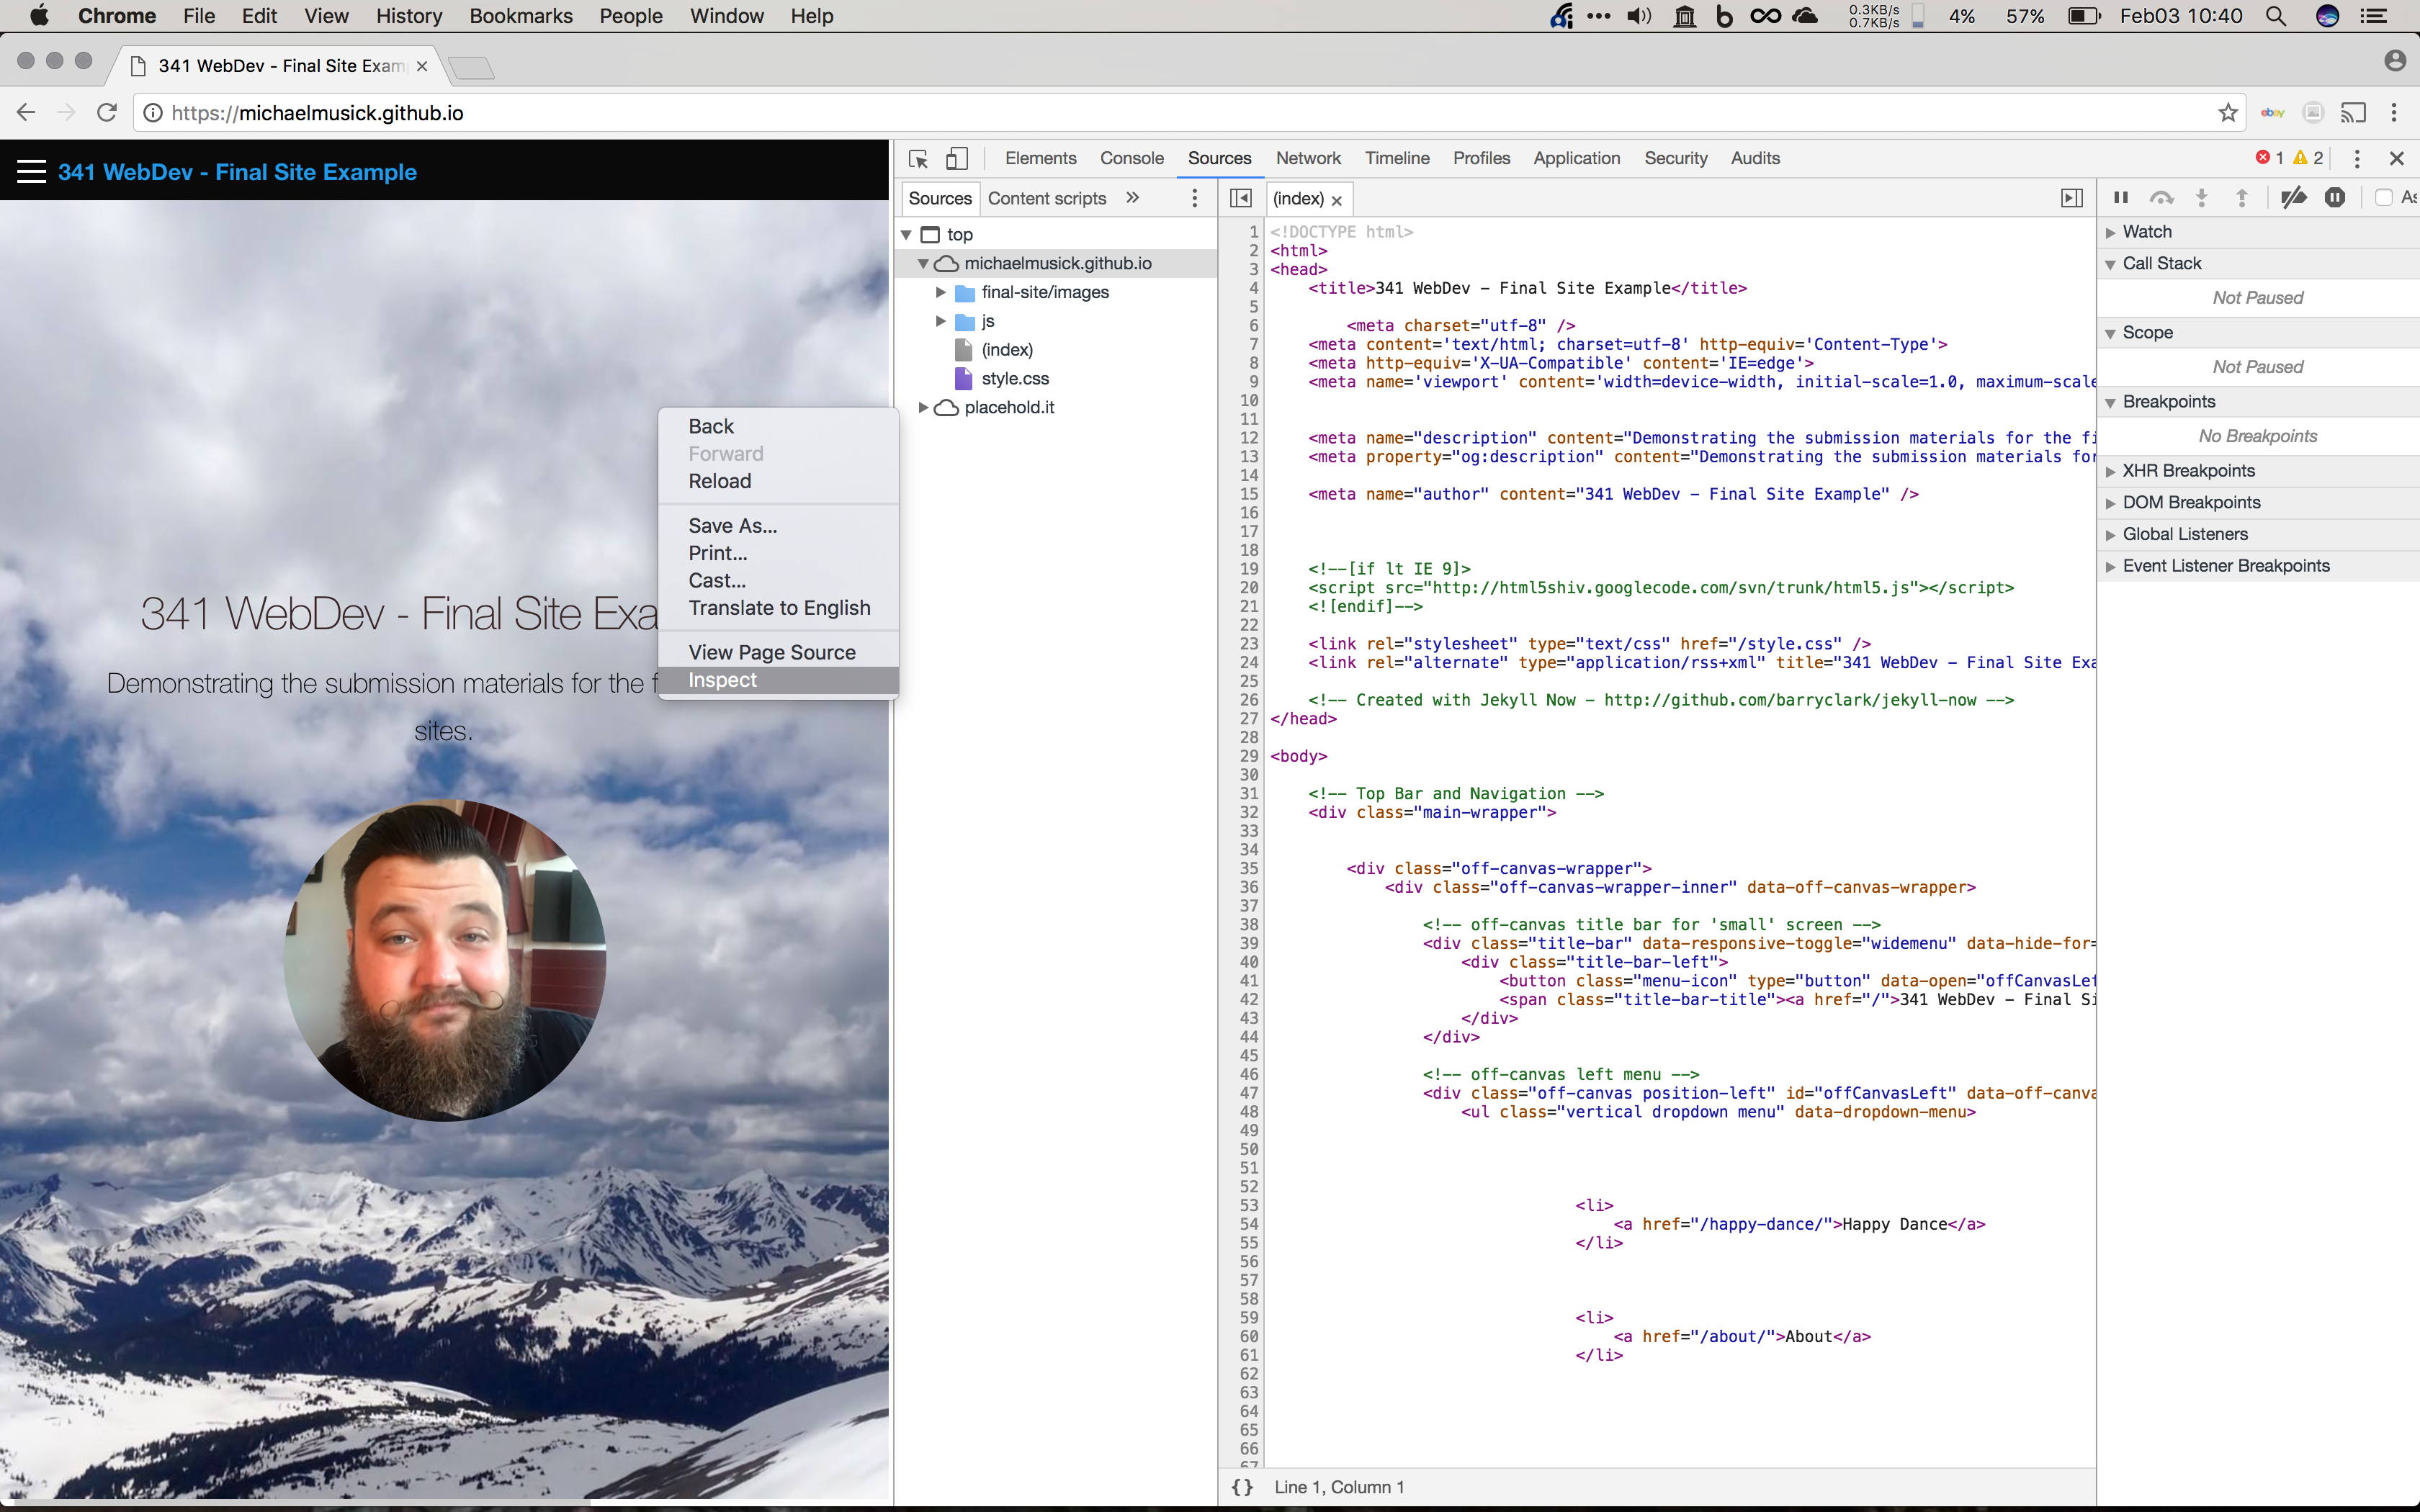
In Chrome, if you right click, you can select “inspect” which will bring up the Chrome developer tools to the right.
You can use the “Elements” tab, to see source code, as well as the matching highlighted element in the actual page (as described below in Safari). You can also select the “Source” tab to see the raw course code files. Again, these allow you to see the code that creates the page your are viewing.
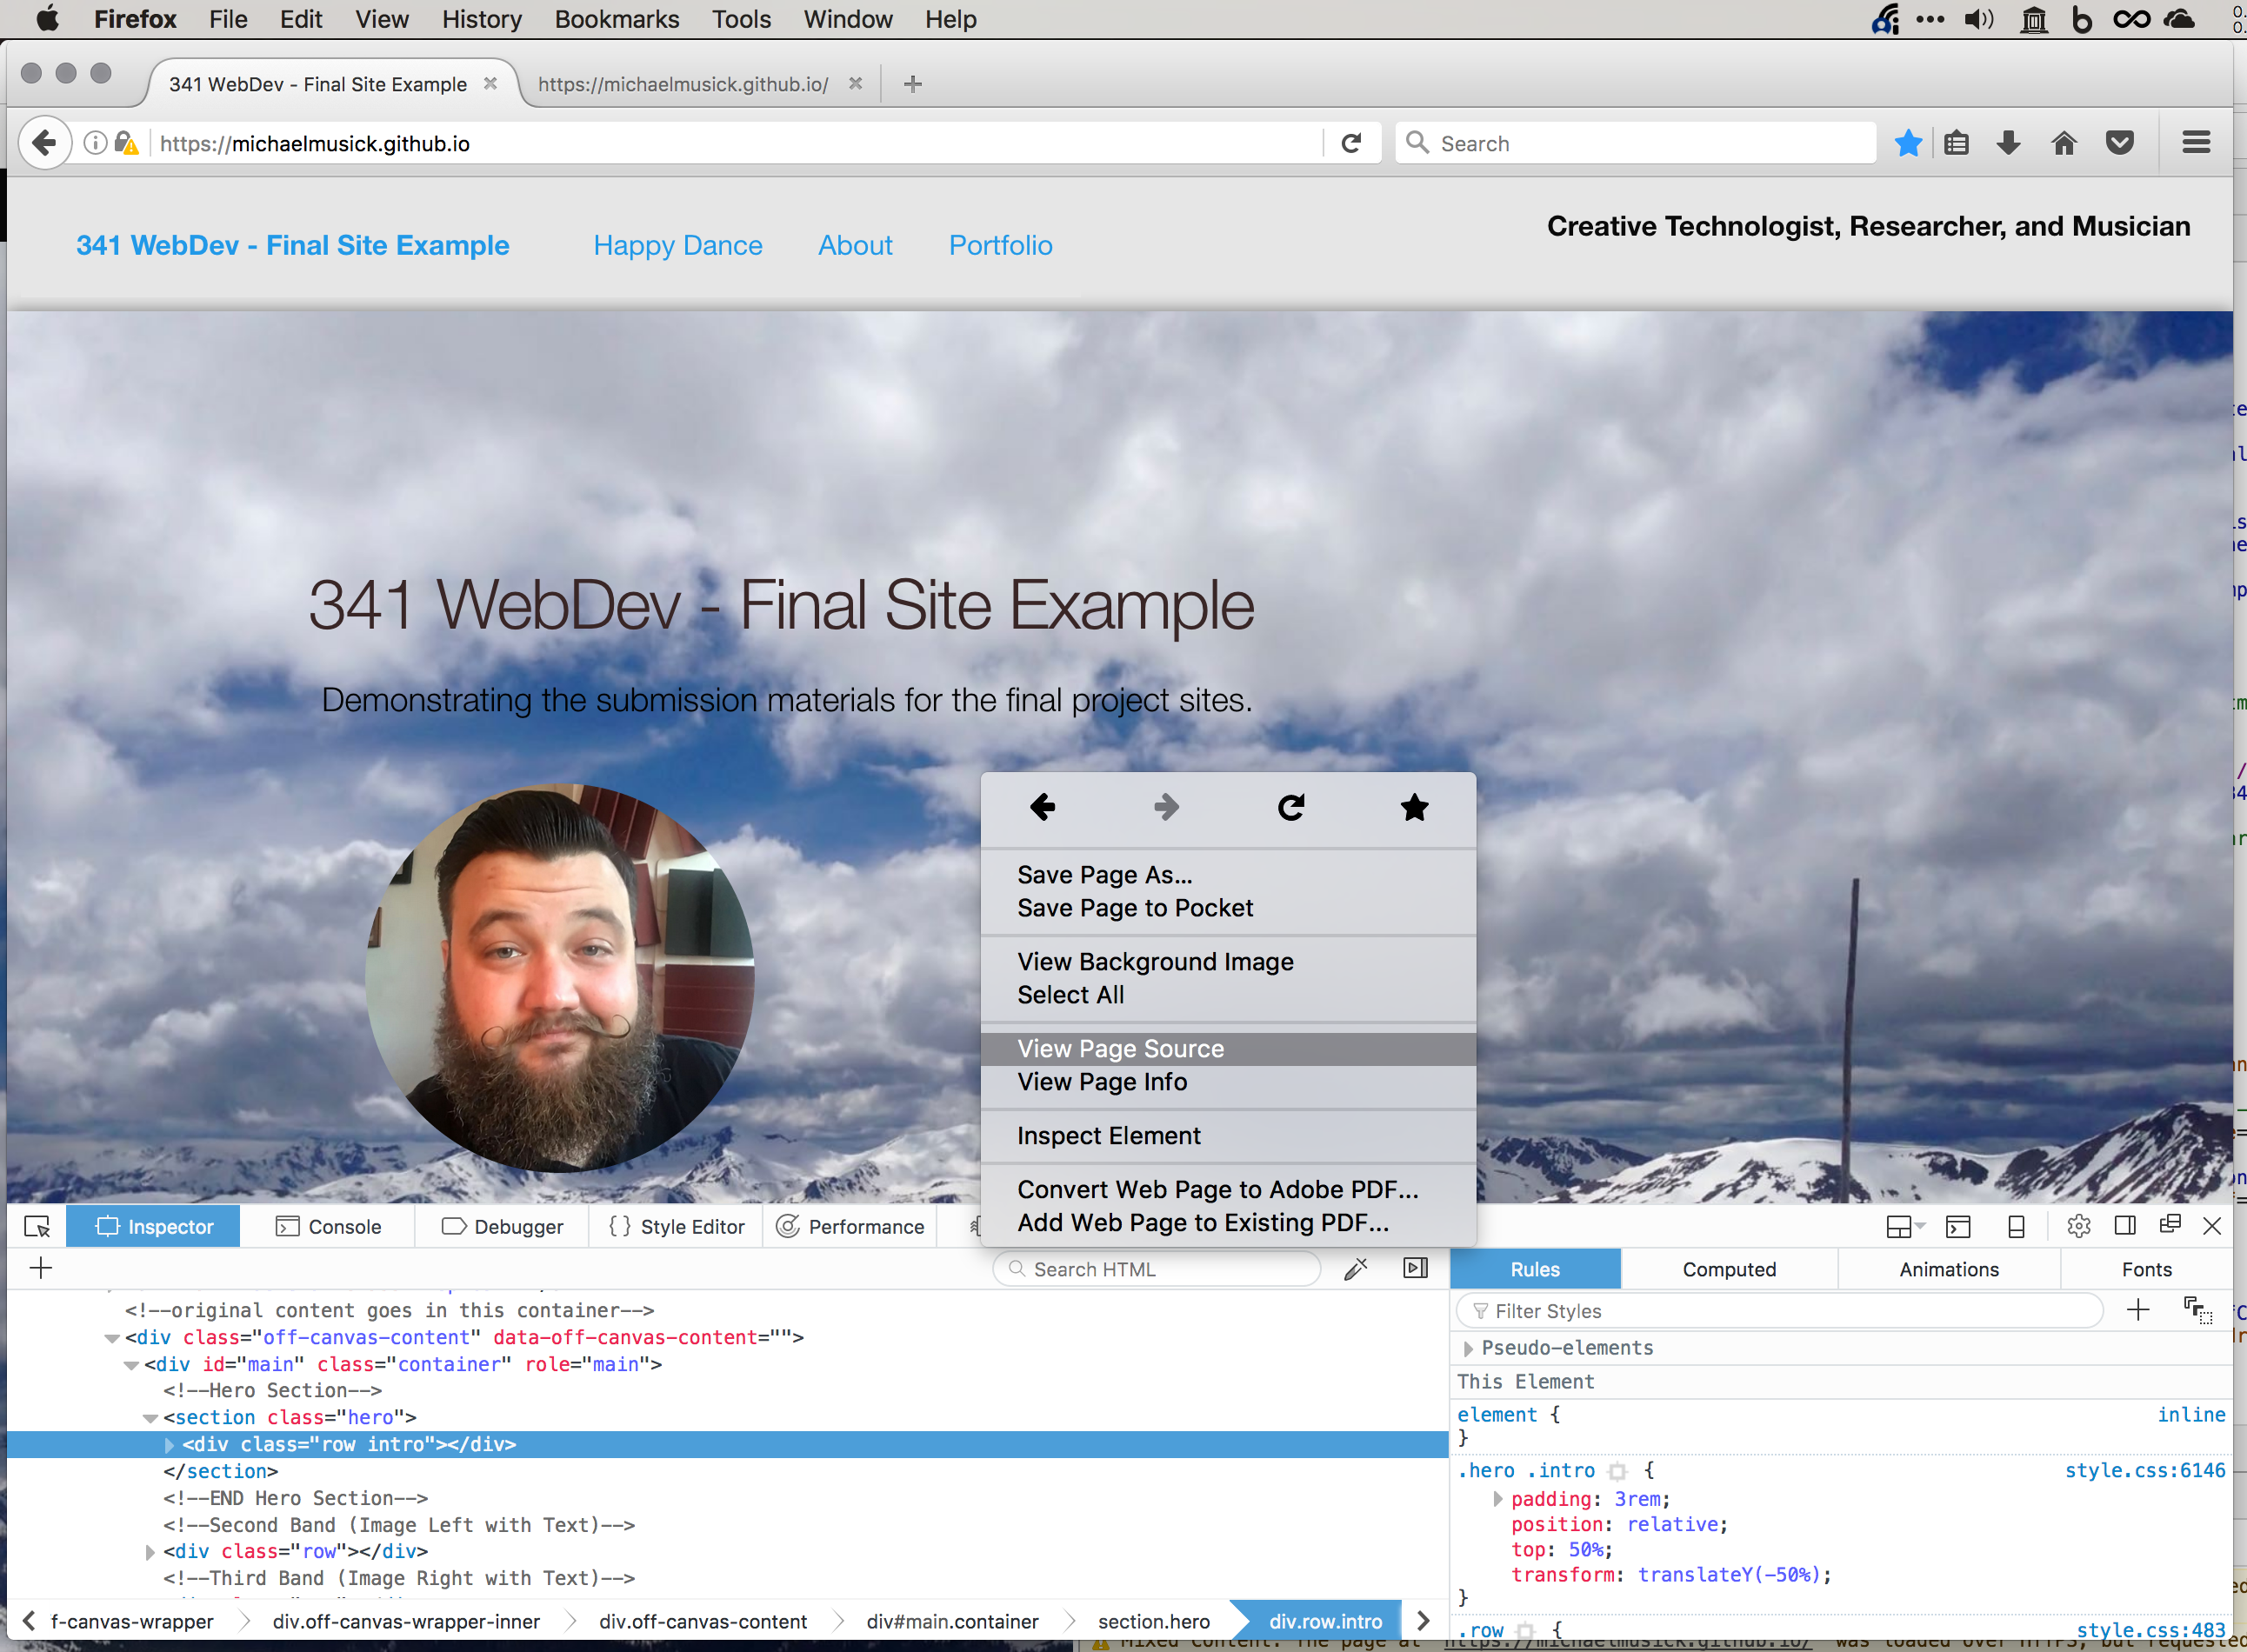
You can do the same thing in Firefox as Chrome. Simply right click in the page you want to see the code for, and select either “View Page Source”, which loads the file in a separate tab, or “Inspect Element”, which open up a more complete set of developer tools.
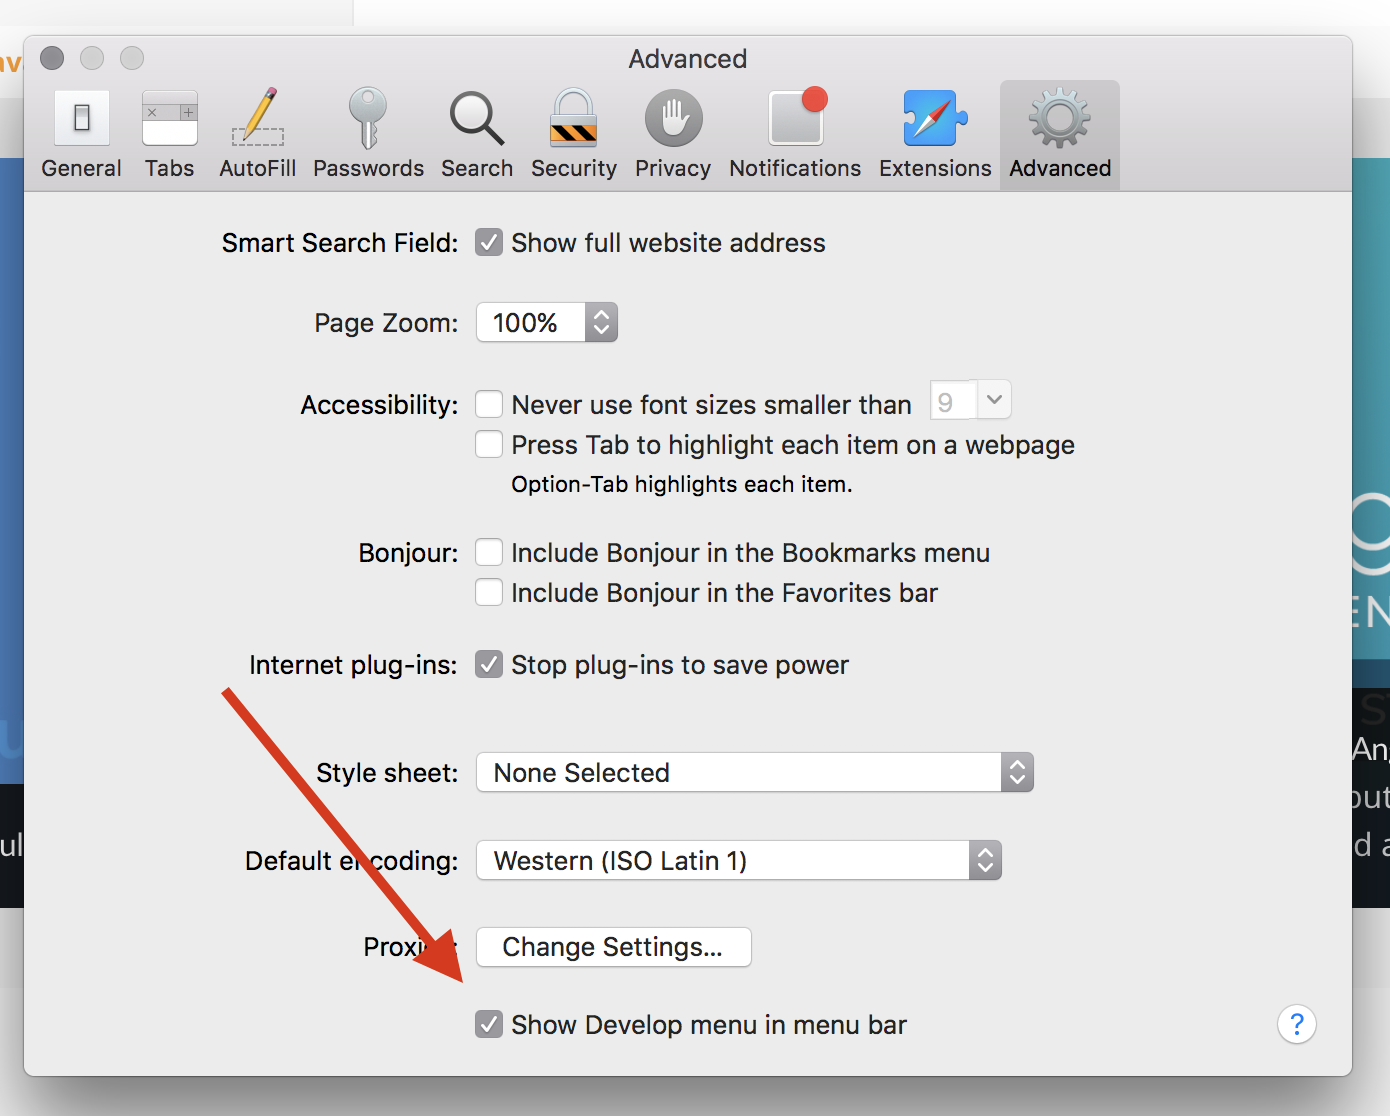
To inspect code in Safari, you first need to make it so you can see the developer tools. To do this:
- Open preferences (
cmd+,). - Go to the advanced tab.
- Select “Show Develop menu in menu bar.”
This will cause a tab to appear in your menu bar. You can now select this menu tab, then select “Show Page Source.”
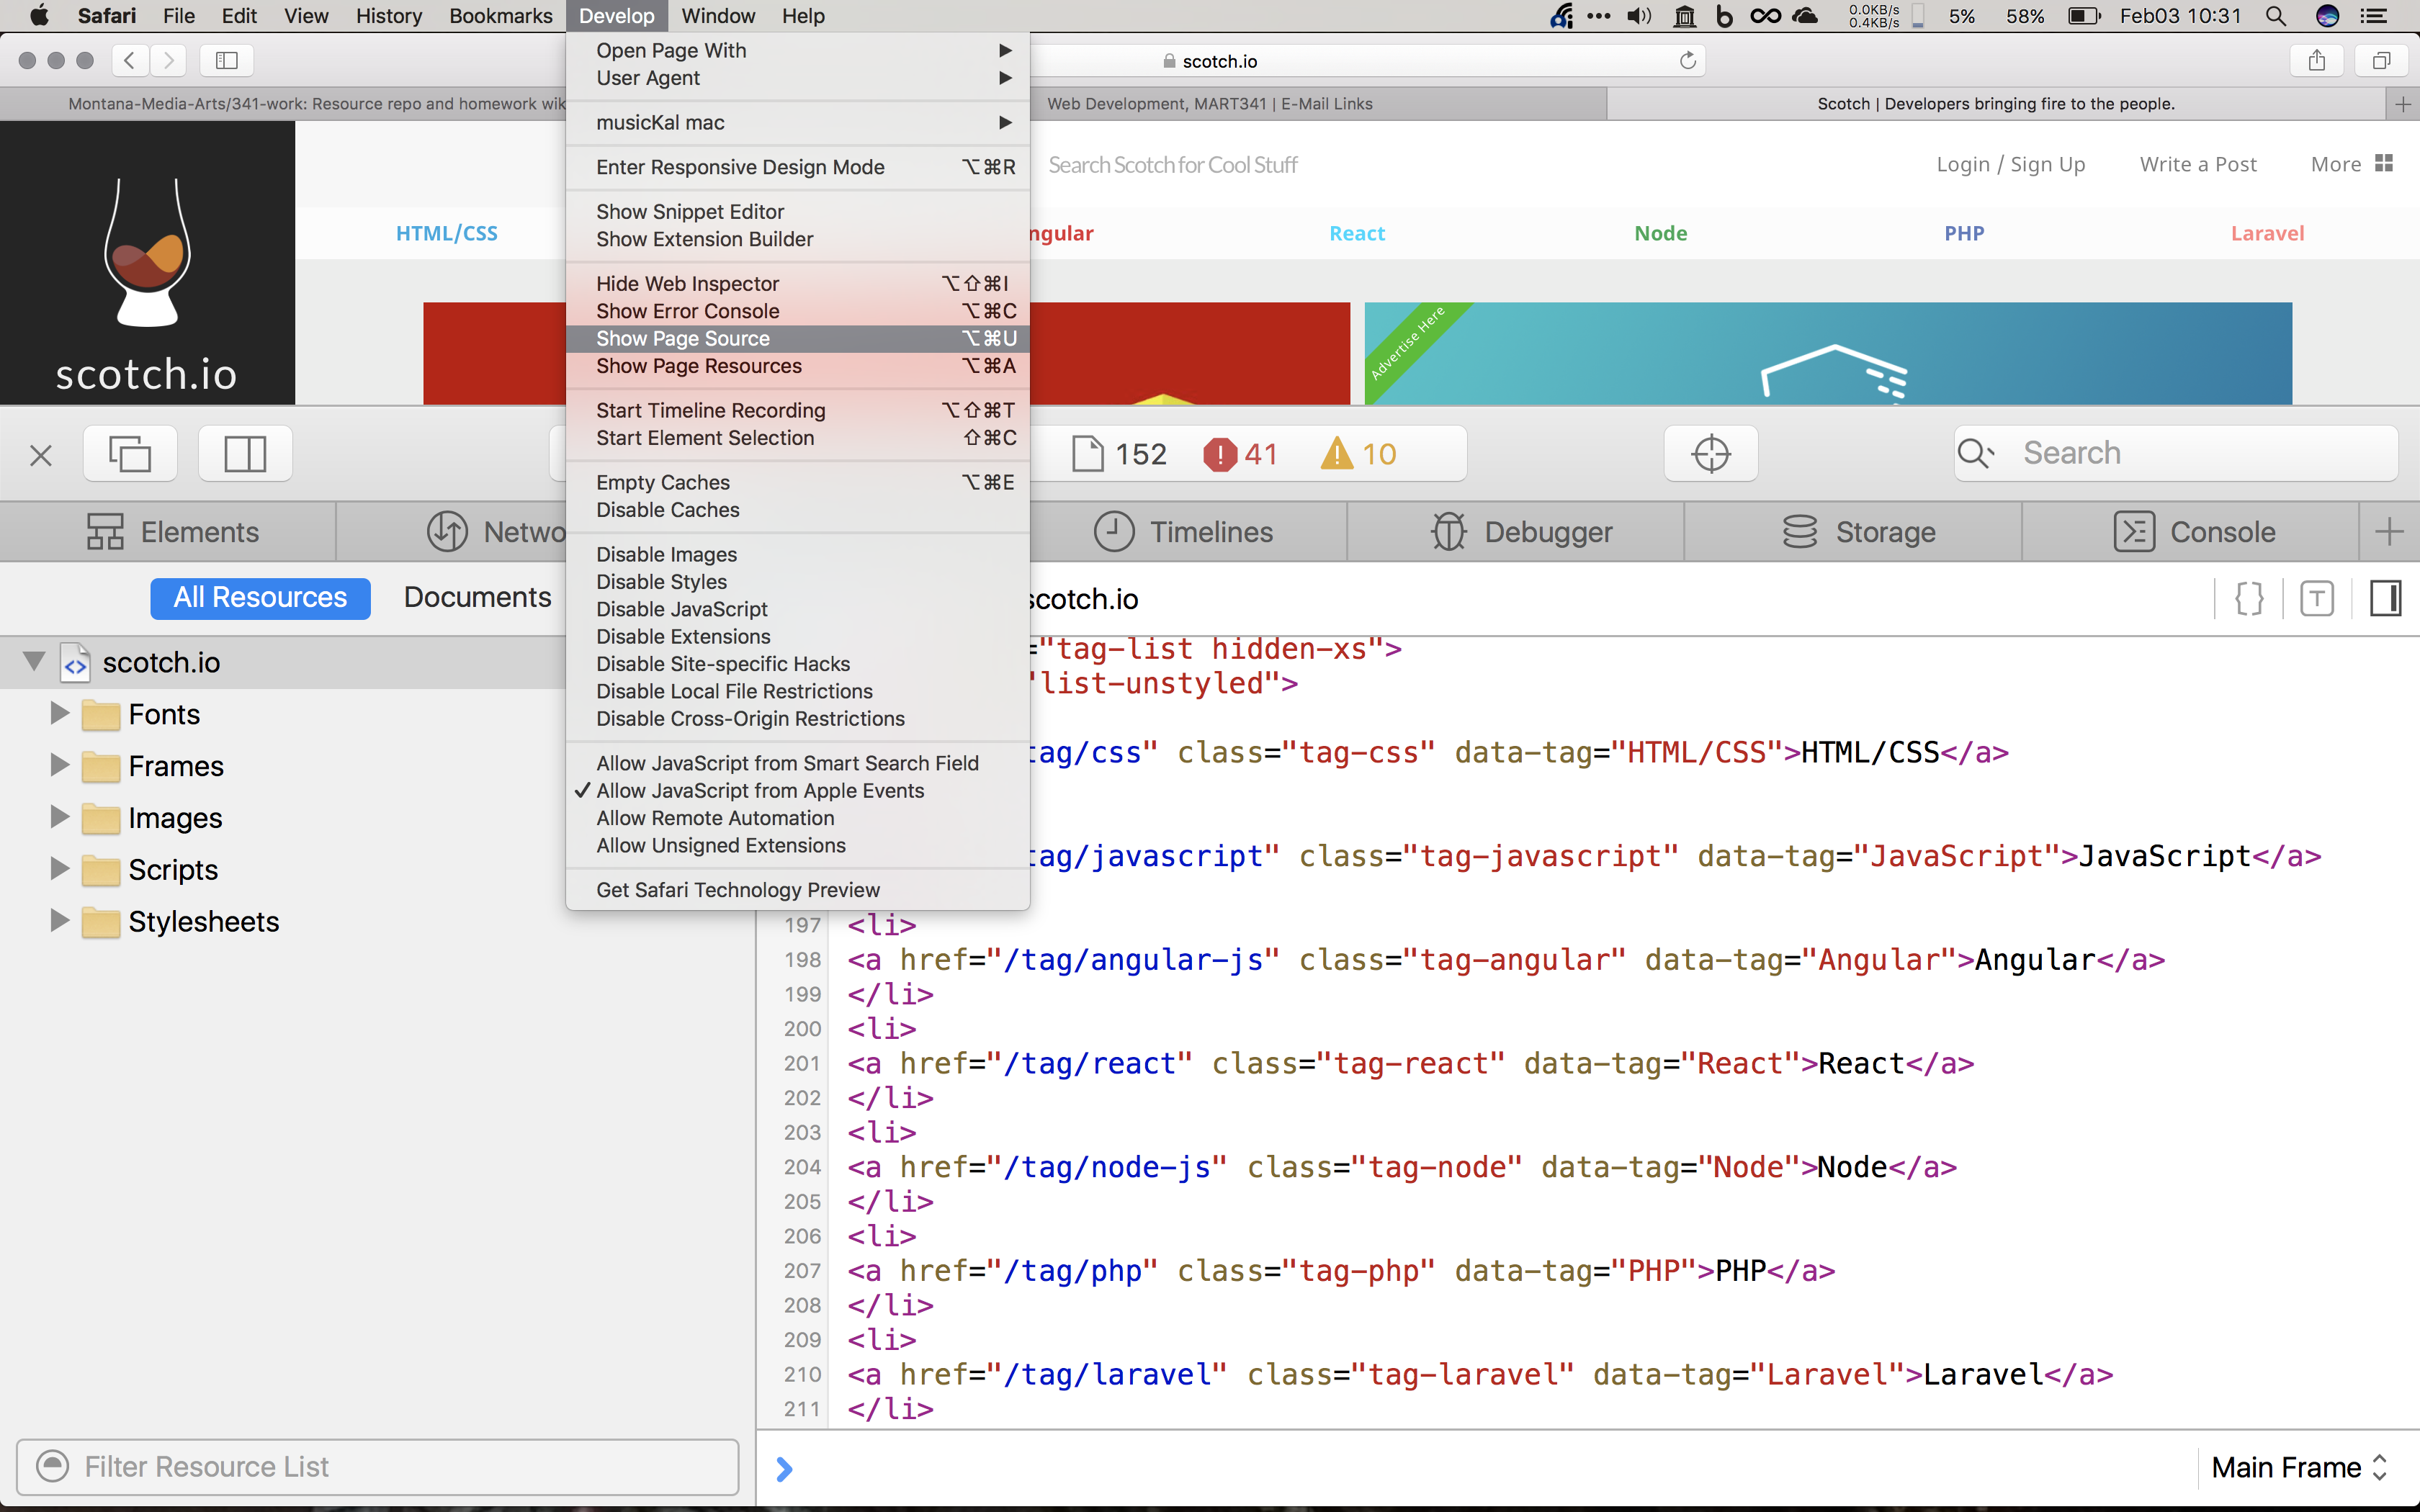
This will bring up a separate window/tab where you can navigate around all of the resources sent over to your browser for the specific web page.
You can also select the “Elements” tab from within this window. This alternative view of the code allows you to see where each html element is in the displayed page. As you move your mouse through the code, various parts of the page will highlight, representing the current element in the code you are inspecting.